Cornish WebServices
Consultancy Ltd
23
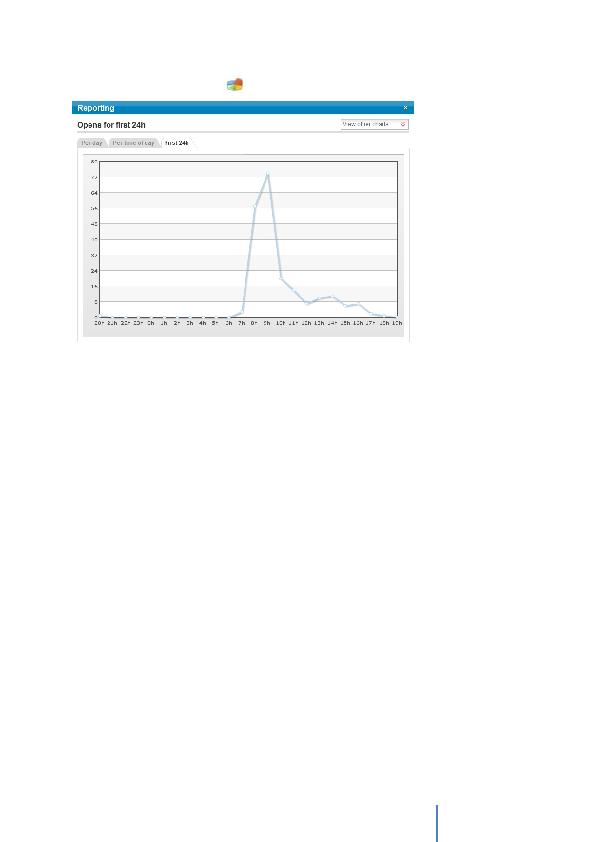
For example, clicking this icon
against Unique Opens displays the following:
This graph consists of three views; Per day, Per time of day and First 24 hours. You can also
view other charts by clicking on the drop down box at the top right of the window.
Underneath the Conversion Funnel are further options:
·
Print report - You can produce a hard copy of the statistics by selecting this option
which can then be customised with your company logo and details of the campaign, as
required.
·
Email hotspot - The report previews your template and shows how many times the links
in this campaign were clicked. When you place your cursor near a link a pop-up
appears. This pop-up tells you how many times a particular link was clicked and how
many unique clicks there have been on this link.
·
Hot prospects - This option enables you to view a list of `Hot prospects' showing the
number of opens and clicks for those prospects.
·
Manage my email updates - This option enables you to specify up to five email
addresses to receive the reports on either a daily or weekly basis.
Everything in blue on the reporting section is a link that drills down.